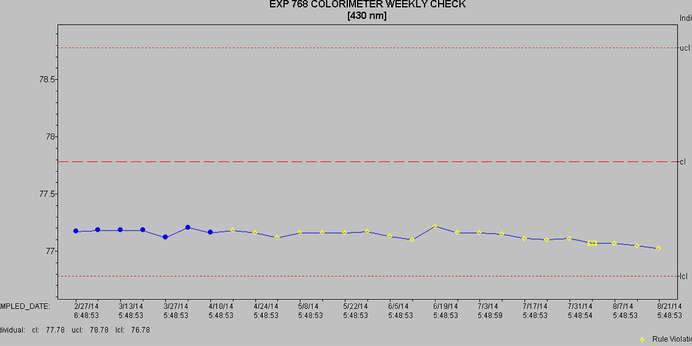
FAQ: “We take the results from the Didymium Filter Test on our HunterLab Vista and plot them in an SPC chart over time to look at trends. We are seeing the 430 and 570 nm filters slowly decrease. Can you help us understand what may be occurring?”
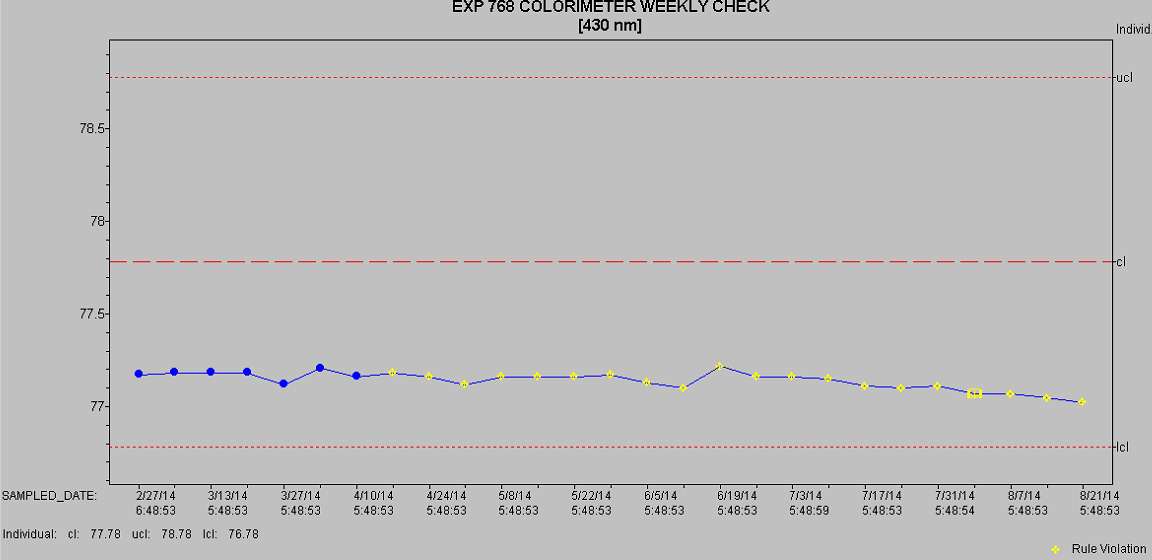
The Didymium Filter Test is an instrument diagnostic test designed to allow the user to self-certify that the wavelength alignment of the instrument optical path is consistent over months and years since the sensor was last wavelength calibrated at the factory.