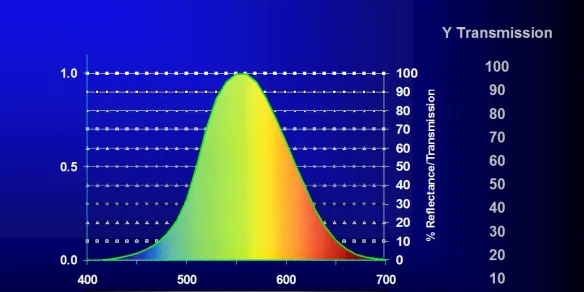
Showing relationship between % spectral transmission and the Y Transmission value.

Quantifying Transparent Color Transmittance and Luminosity Perception in Colorimetry

In addition to representing green in the CIE X, Y, Z tristimulus color scale, the CIE Y is also the 1924 CIE Luminosity or Brightness function which quantifies the way people perceive the relative brightness of equal energy spectral hues. Humans perceive green colors as brighter or more luminous than blue or red.

The Y Transmission value quantifies the overall transmittance of transparent colors.

READ  ASBC Beer Color and Turbidity

For example, let’s say you have a series of 10 neutral density filters starting with a perfect black at 0% transmittance across the visible spectrum, with a dark gray with 10% transmittance, one at 20% transmittance and so on with 10% increases all the way to a perfect colorless at 100% transmittance across the visible spectrum.

These 10 neutral density filters physically transmit light in increments of 10% from a perfect black-through a series of grays-to-a-perfect clear.

Working with many spectral data points for the full spectrums is awkward and if you wanted just a single number to quantify the physical transmittance of these ND filters, the Y Transmission value will do this providing a value of 0, 10, 20, 30…80, 90, 100 respectively corresponding to the overall transmittance of ND filters.

This Y Transmission value is a colorimetric parameter as it provides a single number that corresponds to the physical spectral transmittance of a transparent sample as perceived by a human.

INFO  Get More Information

In summary:

  • The spectral reflectance data tells you the amount in % and where in the visible spectrum, the sample physically transmits light. This is the fundamental spectral signature of the object that provides the stimulus for the color that humans perceive.
  • The Y Transmission value is a single number physical parameter that quantifies the overall transmission of the sample.

It is available in the Color Data View of HunterLab EasyMatch QC software when using one of our sphere instruments standardized in a transmission mode.