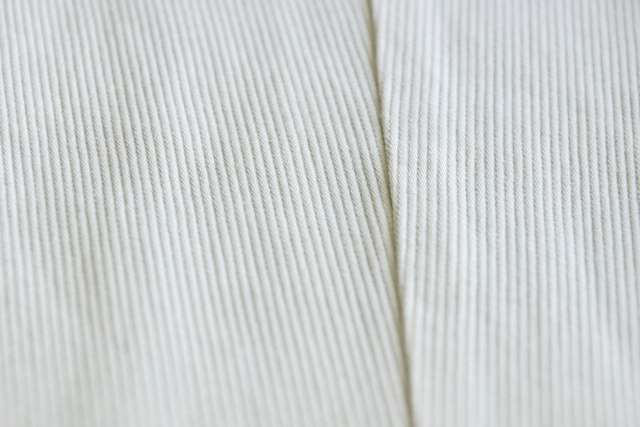
Carpet samples can be challenging to measure because the texture may make the product appear lighter or darker than it really is. Averaging your sample measurements can help you overcome this challenge. Image Source: Shutterstock user Alena Ozerova

Some textiles are more difficult to test for color consistency than others. A textile manufacturer can easily test a swatch of solid blue jersey fabric because the material is flat, opaque, and homogenous. For these types of smooth, solid textiles, all the manufacturer has to do is take one reading on a spectrophotometer to determine whether the dyed jersey fabric meets the manufacturer’s color standards. But not all textiles are homogenous in color; fabrics like corduroy, heavy knits, and terry cloth have texture variations that making them much more difficult to measure with a spectrophotometer. If the manufacturer measures the color of such fabrics in just one small area of the sample, there’s no guarantee that this measurement will match other measurements taken of the same fabric—move just one inch to the right of your first measurement and you’ll likely find that the color reading is completely different.

When testing for color consistency, how do manufacturers compensate for textured or non-homogenous products like this? One method is to average the color measurements in order to get an overall sense of the product’s color. By averaging your sample measurements, you’ll ensure that your color readings are as accurate as possible, even when working with materials that vary significantly in texture. However, in order to use this method properly, you’ll need to know when it’s appropriate to average your samples and when you should take only a single reading. After all, taking multiple measurements of the same sample can be a time-consuming process, so it’s important to only average measurements for the products that actually require this added level of attention.

sample-averaging-2.jpg

Averaging your measurements can help you get an accurate color reading on products like toothpaste, especially those that contain flecks of colorful suspended particles. Image Source: Shutterstock user kikovic

READ  Best Practices for Measuring the Color of Chocolate Bars

What is Sample Averaging?

Sample averaging is an optional color measurement method that allows you to take numerous readings of the same sample or batch in order to obtain a result that best represents the product as a whole. When you take multiple measurements of, say, toothpaste that contains colorful microbeads, each new measurement will likely be slightly different from the last. A nearly-clear toothpaste may appear mostly translucent, but if one area of your sample contains slightly more blue exfoliating particles than another area of the sample, the spectrophotometer could provide you with a color reading that isn’t representative of the entire batch of product. As a result, the spectrophotometer may flag the sample because it appears too blue in just one small area. By taking multiple measurements of the same sample of toothpaste and averaging the results, you can get a more accurate sense of whether the product actually falls within color tolerance.  

There are two ways that you can average color samples of your products: optical or statistical. Here are the key differences between each method:

Optical Measurements

An optical average measurement is performed by a spectrophotometer automatically. Using a color sensor, the instrument observes all of the available spatial data from the sample area of view and averages this finding in order to provide you with a single overall reading. The larger your area of view is, the more accurate this reading will be, as the instrument will have more data available to work with. However, an optical reading alone isn’t always appropriate for every sample. If you have textured samples or samples that vary in color from one area to another, then just one reading may not tell you everything that you need to know about the overall color of the product. Instead, you’ll need to take the additional step of a statistical average measurement.

Statistical Measurements

A statistical measurement goes beyond what many spectrophotometers perform automatically. When you take a statistical average of your sample, you make multiple optical measurements in succession, then calculate a total average measurement for all of those results. Manufacturers have a choice between two different types of statistical measurement methods:

  • Multiple Readings of One Sample: The first option is to take multiple readings of the same sample in different areas. For instance, if you’re measuring shag carpeting, you may set your sample in the spectrophotometer’s area of view so that only the lower right corner of the carpet swatch is visible. Then, once you get your first reading, you can rotate the swatch 90° and measure a different portion of the sample. Repeat this step as many times as you would like, until you feel as though the measurements you’ve taken fairly represent the entire sample. Once this is done, you can calculate the average of all of these measurements, which should give you an accurate representation of the entire sample. To facilitate this process, some spectrophotometers come equipped with sophisticated color measurement software like EasyMatch QC, which will average all of your separate measurements for you.
  • Multiple Readings of Multiple Samples: The second option for taking statistical averages of your samples is to take multiple measurements from the same batch or lot of products. This may be useful if you manufacture products that are themselves mostly homogenous, but that may vary in color between each other. A good example of this is in baked goods. A loaf of bread may be a solid, even shade of brown, but that loaf may appear darker in color than others baked in the same batch.

To test whether your products fall within color tolerance, you can take multiple readings of different product samples, then average those readings to get an overall idea of how that batch compares to other batches. If you’re a bread manufacturer, you may find that one large batch of bread appears consistent in color from loaf to loaf, but if you compare the average readings of the entire batch to that of yesterday’s batch, you may find that yesterday’s batch was much lighter in color, on average. It could be a sign that your ovens are too hot, or that there is another issue in your manufacturing line. By averaging color for the entire lot, you can identify problems like this quickly, before they impact future products.

sample-averaging-3.jpg

Fabrics like corduroy are textured, meaning that some areas of the sample may appear darker to the naked eye than others. Image Source: Shutterstock user Sezamnet

INFO  Get More Information

When You Should Average Your Samples

A wide range of industries average their color measurements in order to ensure that every product falls within color tolerance. Some of the most common examples of products that benefit from averaging include:

  • Translucent liquids that contain suspended particles (like toothpaste or gel exfoliators)
  • Thick, clear gels that contain air bubbles (like hand sanitizer)
  • Products that have scratches or grooves on the surface (like laminate flooring)
  • Hazy samples (like frosted glass)
  • Samples that vary in color or texture from one area to another (like yarn)

To average measurements for products like this, it’s usually wise to set your spectrophotometer to the largest area of view possible in order to get a more accurate reading. In addition, you may wish to rotate or refill your samples at least two to four times so that the spectrophotometer has a large number of measurements that it can average.

Although averaging your samples can offer you a more accurate reading of your products, this method isn’t necessarily the right choice for every industry or manufacturer. One potential downside of averaging is that it can take additional time to perform and in many cases, the spectrophotometer’s first measurement of the sample will closely match the findings of a statistical average measurement. For instance, if you want to measure a sample of paint, which is opaque and typically smooth in texture, then a single color measurement may be perfectly adequate for your needs. However, some manufacturers still choose to take multiple readings of paint products as an extra precaution. This is because environmental factors, such as sample preparation, may impact the color measurement results.

In general, you may wish to average your sample measurements if you want to obtain the most accurate color reading possible for your samples, or if your samples vary too much in texture or color to get an accurate reading from one measurement alone. Some of today’s advanced spectrophotometers are capable of taking multiple measurements of a sample automatically, and many will handle all of the essential calculations for you. It’s never been easier to average your measurements, and this method may just be the best option for your purposes.

HunterLab Flexibility

For more than 60 years, HunterLab has worked closely with manufacturers in a wide range of industries that rely on accurate color measurements to produce the best products possible. Our instruments are currently being used in industries ranging from textiles to cosmetics and from solid samples to liquids to powders. Our flexibility of service, coupled with state-of-the-art spectrophotometers and software, makes HunterLab a leader in the field of color measurement. Contact us to find out how you can get started with our advanced color measurement tools and services.